
The “Carney Effect” could expand advantage to majority
[Ottawa – March 6, 2025] In a profound transformation of the political landscape, the Liberal Party has jumpstarted a moribund and dismal outcome at the beginning of the year to what would be a clear majority outcome if an election were held tomorrow. The principal driver has been a burgeoning national identity and search for economic sovereignty in a coming storm produced by the Trump announcements. So far, Pierre Poilievre has not been able to provide a successful pivot to these new dominant issues and whatever attempts have been made are not reversing these trends. In fact, the Liberal rise has continued even while the Conservatives have made efforts to correct their course.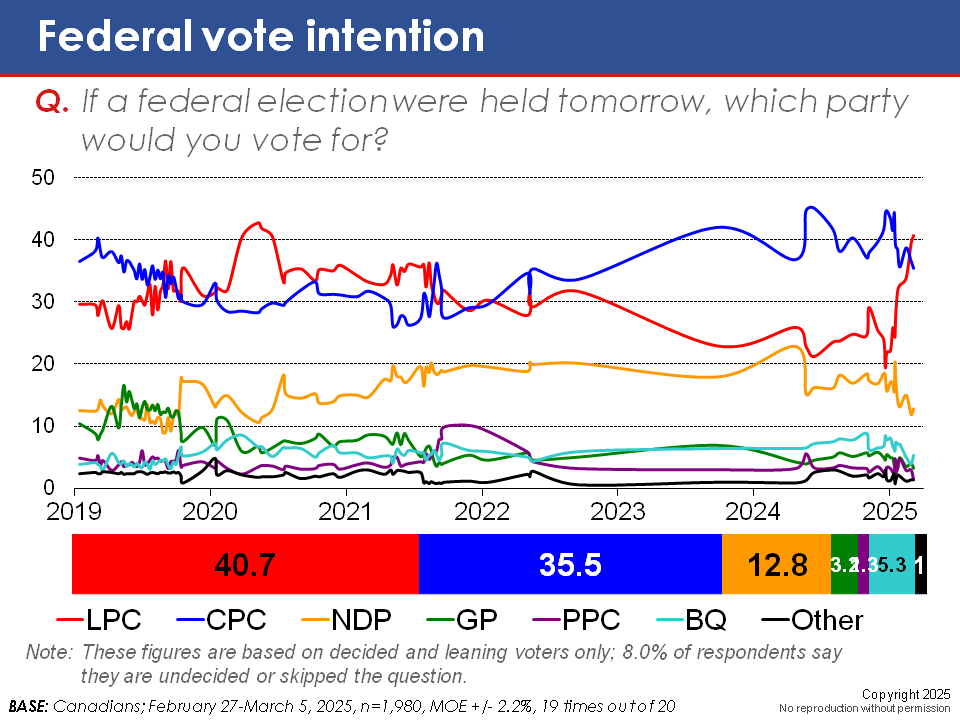
We present a roll-up of results from February 27 to yesterday to get a more reliable and granular picture of what is going on. This large sample of nearly 2,000 cases sees the Liberal Party with a clear lead for the first time since November 2021. The Liberals are at 40.7 per cent nationally, the first time they have broken the 40-point threshold since May 2020. The Conservatives, meanwhile, are at 35.5 per cent while the NDP is at 12.8 per cent. These highly favourable numbers for the Liberals understate the party’s seat advantage, as they now have large and stable leads in Ontario, Quebec, and the Atlantic, while they are competitive in British Columbia.

This distribution would yield a comfortable majority, an advantage that becomes larger when we specifically prompt with Mark Carney as the party leader. We have blended the generic and leader-prompted ballot results as we think that is a reasonable balance. Without a leader prompt, the results are much closer in Quebec and Ontario so the majority outcome would be less certain.

The key fault line is gender, with massive inverse results for men and women voters. Liberal strength is also much higher in over-50 Canada and among the university educated and self-defined middle class. The Conservatives hold a large lead with men and fare extremely well with young men and the non-university educated.


In order to see if things have been shifting since the announcement of the tariffs, we provide a four-day two-day roll-up. In the blended four-day roll, the Liberal advantage expands to just under 10 points. Notably, the effect of citing the leaders does not seem to alter these results, which suggests voters may be taking the “Carney Effect” into account. Looking at just the two nights since the tariffs took effect, the lead over the Conservatives widens to 13 points.

The bottom line is that the Trump and Carney effects have wrought a massive change in the Canadian political landscape in a very short period of time. If anxiety and defiance at the Trump threat are the crucial engines of this shift and if Carney is being seen as the most trusted pilot to negotiate these profound threats, it will be difficult for the Conservative Party to reverse these patterns unless Trump decides to take a very different approach, which seems highly unlikely.
Methodology:
This survey was conducted using Interactive Voice Response (IVR) technology, which allows respondents to enter their preferences by punching the keypad on their phone, rather than telling them to an operator. In an effort to reduce the coverage bias of landline-only random digit dialling (RDD), we created a dual landline/cell phone RDD sampling frame for this research. As a result, we are able to reach those with a landline and cell phone, as well as cellphone-only households and landline-only households.
The field dates for this survey are February 27-March 5, 2025. In total, a random sample of 1,980 Canadians aged 18 and over responded to the survey. The margin of error associated with the total sample is +/- 2.2 percentage points, 19 times out of 20.
Please note that the margin of error increases when the results are sub-divided (i.e., error margins for sub-groups such as region, sex, age, and education). All the data have been statistically weighted by age, gender, and region to ensure the sample’s composition reflects that of the actual population of Canada according to Census data. The results have also been weighted by COVID-19 vaccine uptake to better represent the institutionally mistrustful, who are often less likely to participate in surveys.
No comments:
Post a Comment